
Mineralogy/Biogeochemistry Tools
Contact
GFZ Websites
Infrastructure belongs to
The Environmental Mineralogy and Biogeochemistry Labs are equipped with a very diverse suite of spectroscopic and scattering instruments to determine material chemical composition, structure, surface area and grain size of both synthetic and natural samples. For instance,
-
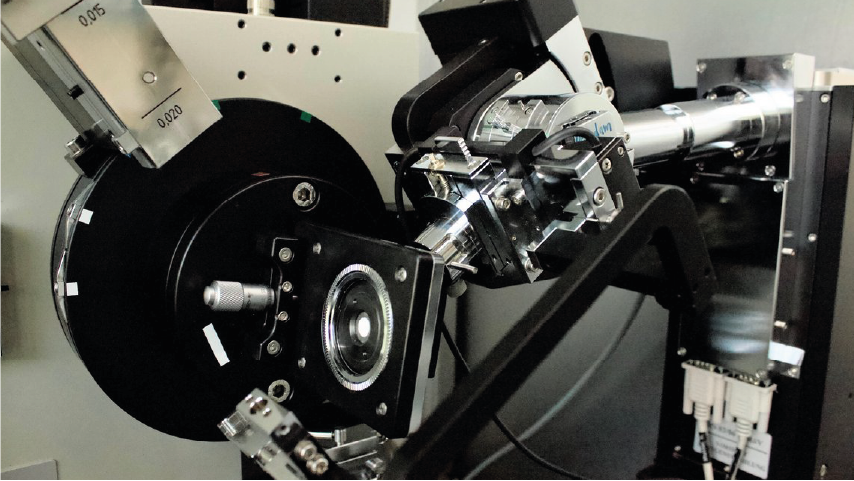
Our powder X-ray diffractometer (XRD) consists of two individual instruments capable of X-ray scattering analysis using both Cu (λ=1.54 Å) and Ag radiation (λ=0.56 Å) in transmission geometry. XRD can be used to analyze both crystalline and amorphous samples by measuring either conventional diffraction patterns or high Q-range total scattering patterns for pair distribution function (PDF) analysis. Measurements can be performed in room or elevated temperature up to 800⁰C.
-
The IR spectrometer is used for fast routine IR spectra acquisition in the 4000-400 cm⁻¹ range with a maximum resolution of 0.9 cm⁻¹, although in practice higher resolution than 4 cm⁻¹ is seldom necessary. IR spectra can be measured on both liquid and solid samples.
-
The UV-Visible (UV/VIS) spectrophotometer measures absorption of light in 190-1100 nm range. Measurements are possible in either ex situ mode in cuvettes or in situ using an external probe. The instrument is mostly used for the determination of elemental concentrations (e.g., Fe²⁺, As, Si, P) using well-established colorimetric methods. In addition, the spectrophotometer can also be used for the in situ and real-time monitoring of the nucleation, crystallization and growth of minerals, and is equipped with Single Cell Peltier System for temperature control and sample stirring.
Categories
Disciplinary Keywords
- Biogeochemistry
- Biogesciences
- Differential Scanning Calorimetry
- Differential Thermal Analysis
- Fourier Transform Infrared Spectroscopy
- Geochemistry
- Microscopy
- Mineralogy
- Optical Microscopy
- Particle Analysis
- Photometry
- Surface Area Analysis
- Thermogravimetric Analysis
- UV-VIS Spectrophotometry
- X-Ray Powder Diffraction
- Zeta-Potential Measurement
Instrumentation
Laboratory instrumentation
Instruments
-
Fourier Transform Infrared Spectrometer
FTIR Spectrometer - Fourier Transform Infrared Spectrometer
Traditional (dispersive) infrared techniques experience difficulties due to the '1 wavenumber at a time' nature of data acquisition. This leads to either a poor signal to noise ratio in a spectrum or a very long time needed to obtain a high quality spectrum. Both these situations cause problems with kinetic work. The first gives inherent large errors, the second prohibits in-situ work. These problems can be overcome using Fourier transform infrared spectroscopy (FT-IR) that is based on the interferometer originally designed by Michelson and a mathematical procedure developed by Fourier that converts response from the 'time' to the 'frequency' domain.
In the Michelson interferometer a parallel, polychromatic beam of radiation from a source (A) is directed to a beam splitter (B), made from an infrared transparent material, such as KBr. The beam splitter reflects approximately half of the light to a mirror, known as the fixed mirror (C), which in turn reflects the light back to the beam splitter. The rest of the light passes through to a mirror, moving continuously, at a known velocity, back and forth along the direction of the incoming light and this is known as the moving mirror (D). Upon reflection from the moving mirror, radiation is then directed back to the beam splitter. At the beam splitter some of the light that has been reflected from the fixed mirror combines with light reflected from the moving mirror and is directed towards the sample. After passing through the sample (E) the radiation is focused onto the detector (F). The detectors are sufficiently fast to cope with time domain signal changes from the modulatio n in the interferometer. Additional information available at http://physics.nist.gov/Divisions/Div842/Gp1/fts_intro.html (Source: Global Change Master Directory (GCMD). 2023. GCMD Keywords, Version 16.3. Greenbelt, MD: Earth Science Data and Information System, Earth Science Projects pision, Goddard Space Flight Center (GSFC) National Aeronautics and Space Administration (NASA). URL (GCMD Keyword Forum Page): https://forum.earthdata.nasa.gov/app.php/tag/GCMD+Keywords)
-
Optical Microscope
-
Particle Analyzer
-
Photometer
Photometers are instruments used for measuring the luminance, luminous intensity, or luminance of a light source; similar to a radiometer, but with an output weighted by the wavelength response of the human eye. (Source: Global Change Master Directory (GCMD). 2023. GCMD Keywords, Version 16.3. Greenbelt, MD: Earth Science Data and Information System, Earth Science Projects pision, Goddard Space Flight Center (GSFC) National Aeronautics and Space Administration (NASA). URL (GCMD Keyword Forum Page): https://forum.earthdata.nasa.gov/app.php/tag/GCMD+Keywords)
-
Surface Area Analyzer
-
Thermal Analysis Platform
-
UV-VIS Spectrophotometer
-
X-Ray Powder Diffractometer
An x-ray powder diffractometer is primarily used for the identification of phases in powder form. An x-ray beam of known wavelength is focused on a powdered sample and x-ray diffraction peaks are measured using a germanium detector; the d-spacing of the observed diffraction peaks is calculated using Bragg's Law [n*lamda = 2dsin(theta)]. The Scintag Pad V automated powder diffractometer uses a Cu x-ray tube with variable filters, a four-sample changer, and a low-noise, high efficiency, liquid-nitrogen cooled germanium detector. The goniometer is automated and software packages are run from a PC running Windows NT 4. A number of Scintag software packages are available for routine powder diffraction data acquisition, background correction and peak identification. Unknowns can be matched to JCPDS cards in an on-line database. Other software is available for quantitative analysis of powder mixtures, unit cell refinement, Rietveld analysis, and GSAS structural analysis. Samples sho uld be prepared as powders with a grain size of 10 um (approximately), and typically about 100 milligrams of sample is required. Additional information available at "http://www.gps.caltech.edu/facilities/analytical/xrd.html" [Summary provided by Caltech] (Source: Global Change Master Directory (GCMD). 2023. GCMD Keywords, Version 16.3. Greenbelt, MD: Earth Science Data and Information System, Earth Science Projects pision, Goddard Space Flight Center (GSFC) National Aeronautics and Space Administration (NASA). URL (GCMD Keyword Forum Page): https://forum.earthdata.nasa.gov/app.php/tag/GCMD+Keywords)
-
Zeta-Potential Analyzer
Links
GFZ Websites
Relationships
- is part of
- is related to